We will surely never solve all the mysteries of the universe. But, as Jon Cartwright reports, spectroscopy holds the key to unravelling many planetary secrets
We will surely never solve all the mysteries of the universe. But, as Jon Cartwright reports, spectroscopy holds the key to unravelling many planetary secrets
Stars, planets and other gems in the night sky for so long seemed, both literally and metaphorically, worlds apart. Even the great 19th century French philosopher Auguste Comte, for all his novel perspectives on science, wrote that the internal make-up of ’heavenly bodies’ would be ’forever excluded from our recognition’. How wrong he was.
Today, there is no question of unravelling the make-up of objects in space. We know that elements found on Earth, namely hydrogen and helium, are also found on our sun. We know that the sun itself is just one of many trillions of stars, of which some are bigger, hotter, and contain heavier elements. We know the basic composition of planets in our solar system and that similar planets exist in systems throughout the galaxy. We even know a little about how these structures came to be, their dynamics, and how they are evolving in space and time.
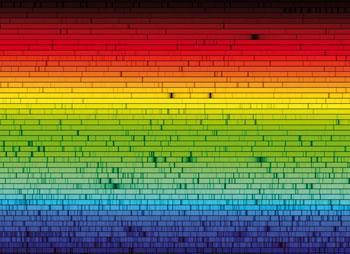
Almost all this and more besides is thanks to spectroscopy, a technique that reveals what an object is made of simply from the mix of light it emits. Since its emergence in the mid 19th century - just a few years after Comte made his inauspicious statement - spectroscopy has become the most important tool in astronomy, and in recent years there has been no end to its new discoveries.
Yet in many ways spectroscopy is an unsung hero. As the public swoon over impressive, falsely coloured images from space telescopes like Hubble, little attention is paid to the real technique behind the science. ’The problem we have publicity-wise is that the public finds it very difficult to conceptualise what spectra are about,’ explains Mike Barlow, an astrophysicist at University College London, UK. ’So whenever we put out press releases, we put out images, and if we do put out a spectrum, it’s a very simple one and great care is taken to explain it. It’s a great pity, because that’s where the information domain really is.’
Regional focus
So what information does spectroscopy contain? In general, each region of a spectrum tells something different. The lowest energies, from millimetre to far-infrared wavelengths, reveal the rotational transitions of molecular bonds and can therefore be used to pick out the types of bond present. The mid- and near-infrared also highlight molecular bonds, although they focus more on vibrational, bending and stretching transitions. The optical and ultraviolet reveal the electronic transitions of atoms and molecules, while x-rays probe the most tightly bound energy levels of heavy elements.
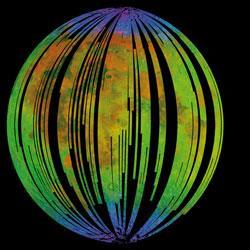
A good example of how spectroscopy can pick out key molecular bonds came in September 2009 when Nasa’s M3 (Moon mineralogy mapper) instrument, loaded onto India’s Chandrayaan-1 mission, was reported to have detected strong evidence for water on the moon. For decades scientists had debated whether the moon contains water, partly because any moisture could potentially be tapped by future astronauts living there. But although past samples returned from the surface have revealed small amounts of water in inner volcanic rock, and although radar measurements have hinted at frozen water contained within shadowy impact craters, evidence for surface water has been in short supply.
Like most spectrometers, M3 used a finely grooved piece of glass known as a diffraction grating to split incident light into its constituent wavelengths before recording the subsequent spectrum on a charge-coupled device (CCD). The instrument made use of visible and near-infrared sunlight that is reflected off the moon, and, by spotting which wavelengths are most prominent, determined which molecules are present on the surface. The crucial line on the M3 spectrum came at a wavelength of about 3 m m, corresponding to the energy at which the vibration of oxygen-hydrogen bonds - the building block of water molecules - absorb light. According to the data, water could be present in concentrations as high as 1000 parts per million - still drier than a desert on Earth, but moist by extra-terrestrial standards. ’Perhaps the most valuable result of these new observations is that they prompt a critical re-examination of the notion that the moon is dry,’ wrote the University of Hawaii’s Paul Lucey in Science, where the M3 results were published. ’It is not.’
As Chemistry World went to press, Nasa announced that its Lcross satellite had collected further infrared evidence of water on the moon.
Watery discoveries
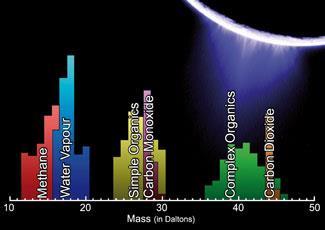
Spectroscopy has also uncovered other places in the solar system that contain water. In October 2007, for example, Nasa’s Cassini spacecraft flew by Saturn’s moon Enceladus and, using its ultraviolet spectrometer UVIS, confirmed an earlier discovery of supersonic water jets erupting from the surface - a discovery that also hinted at underground lakes. This summer, INMS (ion neutral mass spectrometer) data from Cassini gave further evidence for the existence of water on Enceladus by detecting ammonia, a natural antifreeze.
Meanwhile, Nasa’s Mars Reconnaissance Orbiter, which has been circling the red planet since March 2006, has used its visible-infrared spectrometer Crism (Compact reconnaissance imaging spectrometer for Mars) to confirm several craters filled with pure ice.
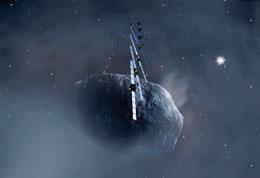
But water is just one of many aspects of composition that interest planetary scientists. In late 2007, an infrared and ultraviolet spectrometer onboard the European Space Agency (Esa) Venus express probe revealed high levels of deuterium in the planet’s atmosphere. Scientists concluded that this was a remnant of huge oceans that had boiled off as the result of a runaway greenhouse effect, a scary harbinger perhaps of what unchecked climate change could do to Earth. More recently, spectrometers onboard Nasa’s Messenger probe have been finding signs that the surface of Mercury is formed from planes of solidified lava, suggesting that the planet has been rife with volcanic activity. Then there’s the wealth of other spacecraft that will be passing back data in years to come, from Esa’s Rosetta, which, in 2014, will investigate the comet 67P - which orbits the sun - to uncover secrets of the early solar system, to Nasa’s New horizons, which will reach Pluto and other Kuiper belt objects for studies in 2015. ’Short of landing on a planet and making an in situ measurement, spectroscopy in one form or another is the only way of determining the chemical composition of anything,’ says Ian Crawford, who chairs the science team for the Chandrayaan-1 mission’s x-ray spectrometer, C1XS. ’So essentially almost our whole knowledge of the composition of the solar system has been derived from spectroscopy.’
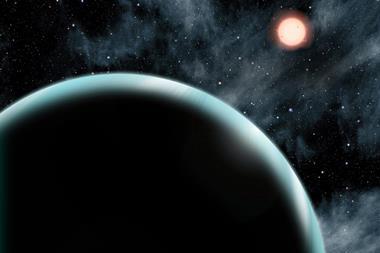
Yet the solar system is just the beginning. For nearly 15 years, astronomers have been amassing observations of various extra-solar planets or ’exoplanets’ that exist elsewhere in our galaxy. There are various methods of detecting an exoplanet, but perhaps the most common is either to see the wobble its gravity induces in its parent star, or to monitor the degree to which its parent star dims as it passes in front. To date, more than 350 exoplanets have been discovered, mostly using expansive ground-based telescopes. But space telescopes can make an important contribution, in particular because the lack of atmospheric distortion allows continuous monitoring and a greater chance of spotting smaller, perhaps even Earth-sized planets.
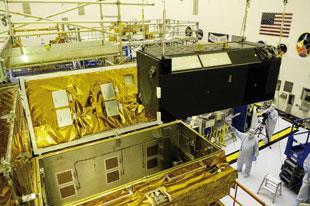
In the past couple of years, both Nasa’s Kepler and the French-led Corot space telescopes blasted into space to search specifically for exoplanets. They join existing space telescopes that, although not as well adapted, have been steadily increasing our tally of distant worlds. Nasa’s Spitzer infrared space telescope, for instance, has been associated with some of the landmark discoveries. In 2005 it captured the first direct light from an exoplanet, and in 2007 it was the first to map the temperature of an exoplanet’s atmosphere. All these measurements reinforce the notion that our solar system is no fluke, and many astronomers think it won’t be too long before we discover the first one to harbour something that resembles our little blue planet.
Super scale
Perhaps some of the most important developments using space telescopes, however, have come in the origins of large-scale structure. Here, at least, theory is way ahead of observation. Thanks to Nasa’s Wmap (Wilkinson microwave anisotropy probe), which maps fluctuations in the microwave radiation left over from the big bang, we know what the universe looked like some 40 000 years into its lifetime. Back then it was almost completely uniform, but at some point over the subsequent 13 billion years gravity began to make things clump together, ultimately producing the myriad stars, galaxies and galaxy clusters we see today. There are plenty of computer models to suggest how the universe went from smooth to clumpy, but observations have yet to fully bear them out.
Nasa’s Hubble telescope is making some of the fastest progress in this area. In May 2009, astronauts on a servicing mission repaired its Stis (space telescope imaging spectrograph) ultraviolet spectrometer and installed a new, more sensitive ultraviolet spectrometer called Cos (cosmic origins spectrograph). Unlike other spectrometers, Cos performs all the light dispersion and collection in a single, high-performance optic and has a CCD with a huge diameter of 185 mm. The idea is that Stis and Cos will complement each other: Stis providing wide-angle views while Cos focuses on fainter and much smaller objects. Cos’s sensitivity will also open up science that previously would have taken too long in exposure times. ’People may have wanted to observe with the old instrument something that would have taken 20 days, and that wouldn’t have got approved,’ explains James Green, Cos’s principal investigator, at the University of Colorado in Boulder, US. ’But now it takes one day, and suddenly that science can be approved.’
One of the ways Cos will shed light on the evolution of large-scale structure is by pointing its aperture at bright, distant galaxies known as quasars. The light from quasars themselves is mostly featureless, but this means they act as an effective backlight to illuminate dust, gas, and other material in the interstellar medium, which can then leave their fingerprints on the spectrum. Over the next few years, Cos will use hundreds of quasars in this way to build up a map of space between galaxies where, perhaps surprisingly, most of the universe’s mass resides. Some of this mass comes in relatively heavy elements such as oxygen, which can only be generated in stars. Cos might be able to show how it got there.
X-ray specs
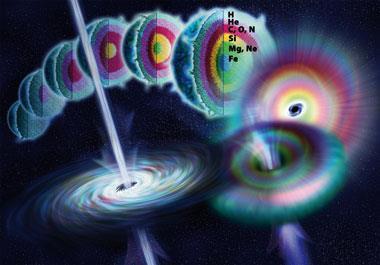
Beyond the ultraviolet, x-rays can help scientists to understand high-energy phenomena, from the sun’s coronae to neutron stars, active galactic nuclei and gamma-ray bursts. Indeed, the origins of gamma-ray bursts were the subject of much speculation for decades since their discovery in the late 1960s, with no consensus on whether they should come from our own Milky Way or from much deeper space. This changed in 1997, when the Italian-Dutch x-ray satellite BeppoSAX caught a glimpse of a fading x-ray ’afterglow’. Several models of gamma-ray bursts had predicted afterglows as the result of ejected material colliding with interstellar gas. BeppoSAX’s discovery enabled the gamma-ray burst to be located, imaged, and ultimately traced billions of light years away to the farthest reaches of the universe.
But the biggest discovery using space spectroscopy of recent times was to come the following year, in 1998. Two groups of astrophysicists had been plotting the recession, or red shift, of distant ’type 1a’ supernovae using spectrometers including Stis on Hubble. Type 1a supernovae are known as standard candles because of their consistent luminosity, so their measured brightness tells how distant they are and therefore to what age of the universe they belong. By comparing the recession and age, the two groups found not only that the universe was expanding - which had then been known for 70 years - but that its expansion was accelerating. It was a surprising result, because astrophysicists had assumed gravity would slow the expansion by pulling matter together. The implication was that about three-quarters of the universe’s mass must consist of some unknown, gravitationally repulsive substance: dark energy.
In the past decade, very little progress has been made in determining the nature of dark energy. Nonetheless, it seems obvious that observations using spectroscopy will help one way or another, either using existing telescopes or with the many missions that are in planning or that are soon to begin scientific measurements. Esa’s Herschel space observatory, complete with three visible and infrared spectrometers, reached orbit in May, and mission scientists say it is meeting expectations, based on images taken during its ’performance verification phase’. Then, five years from now, Nasa plans to launch the James Webb space telescope, which will examine infrared light from the oldest parts of the universe, 10 to 100 times fainter than the limit of its predecessor Hubble’s vision.
For the best part of 150 years spectroscopy has proved the key to unlocking secrets of the heavens. It doesn’t look as though that’s going to change any time soon.
Jon Cartright is a freelance journalist based in Bristol, UK


No comments yet